
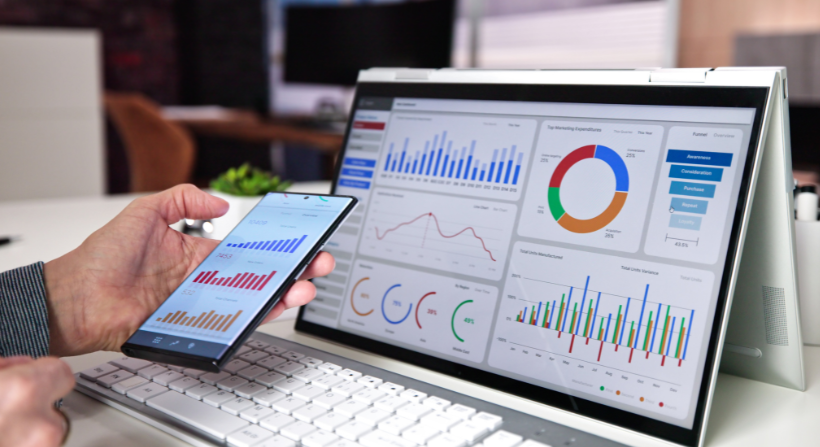
Data is generated every second. Every online purchase, customer interaction, website visit, mobile app activity, and business transaction creates valuable information. Organizations collect massive amounts of data every day, but collecting it alone does not improve business performance.
The real value comes from understanding what that data is saying and using those insights to make better decisions. This process is known as data analytics.
Today, data analytics has become one of the most important capabilities for modern businesses. Organizations use it to understand customer behavior, improve operations, reduce costs, predict future trends, and support artificial intelligence initiatives. Companies that can turn raw data into meaningful insights often make faster and more informed decisions than their competitors.
In this guide, we will explain what data analytics is, why it matters, the different types of analytics, how the analytics process works, the technologies involved, common business use cases, and why building a strong data foundation is essential for successful analytics.
- What Is Data Analytics?
- Why Data Analytics Matters
- The Four Types of Data Analytics
- How the Data Analytics Process Works
- Common Business Applications of Data Analytics
- Technologies Used in Data Analytics
- Common Challenges in Data Analytics
- Data Analytics and Artificial Intelligence
- Best Practices for Successful Data Analytics
- How Tenplus Helps Organizations Succeed with Data Analytics
- Conclusion
- FAQs
What Is Data Analytics?
Data analytics is the process of collecting, organizing, cleaning, analyzing, and interpreting data to discover useful insights that support business decisions.
Rather than relying on assumptions or intuition, organizations use data analytics to understand what has happened, why it happened, what is likely to happen next, and what actions should be taken.
Data analytics can be applied to almost every business function, including:
- Sales
- Marketing
- Finance
- Operations
- Manufacturing
- Healthcare
- Retail
- Customer service
- Supply chain management
The goal is simple. Turn raw data into information that helps people make smarter decisions.
Why Data Analytics Matters
Every business makes hundreds or even thousands of decisions every day.
Examples include:
- Which products should receive more investment?
- Which customers are most likely to leave?
- Where can operating costs be reduced?
- Which marketing campaigns deliver the highest return?
- Which regions are growing the fastest?
- How can customer satisfaction be improved?
Without reliable data, these decisions often rely on assumptions.
Data analytics replaces guesswork with evidence.
Organizations that use analytics effectively are able to respond faster to market changes, improve customer experiences, reduce waste, and identify new business opportunities.
As businesses continue investing in artificial intelligence, the importance of data analytics continues to grow because AI systems also depend on trusted and well-organized data.
The Four Types of Data Analytics
Data analytics is generally divided into four categories. Each type answers a different business question.
Descriptive Analytics
Descriptive analytics explains what has already happened.
It summarizes historical information using reports, dashboards, and visualizations.
Examples include:
- Monthly sales reports
- Website traffic
- Customer growth
- Revenue trends
- Inventory levels
Descriptive analytics gives organizations a clear picture of current and past performance.
Diagnostic Analytics
Diagnostic analytics explains why something happened.
It looks deeper into the data to identify the reasons behind business outcomes.
Examples include:
- Why sales declined in one region
- Why customer complaints increased
- Why production costs changed
- Why website traffic dropped
This helps organizations understand the root cause of problems rather than simply observing them.
Predictive Analytics
Predictive analytics uses historical data to estimate future outcomes.
It often combines statistical methods and machine learning to identify likely trends.
Businesses use predictive analytics to:
- Forecast demand
- Predict customer behavior
- Estimate future revenue
- Identify equipment failures
- Detect fraud
Predictive analytics helps organizations prepare for future events instead of simply reacting to them.
Prescriptive Analytics
Prescriptive analytics goes one step further.
Instead of predicting what may happen, it recommends the best course of action.
Examples include:
- Optimizing delivery routes
- Recommending product pricing
- Improving inventory levels
- Allocating marketing budgets
This type of analytics supports better decision-making through data-driven recommendations.
Quick link: What Is Snowflake? Simple Guide for Beginners
How the Data Analytics Process Works
Successful analytics involves much more than creating charts and dashboards.
It follows a structured process that ensures data remains accurate and useful.
Step 1: Data Collection
The process begins by gathering information from different sources.
These may include:
- CRM systems
- ERP platforms
- Websites
- Mobile applications
- IoT devices
- Financial systems
- Marketing platforms
The more complete the data, the better the analysis.
Step 2: Data Cleaning
Raw data often contains errors.
Organizations may encounter:
- Duplicate records
- Missing values
- Incorrect formats
- Inconsistent information
Cleaning the data improves accuracy before analysis begins.
This step is one of the most important parts of the analytics process because poor-quality data leads to unreliable insights.
Step 3: Data Transformation
Data from different systems rarely follows the same structure.
Transformation prepares the information for analysis by:
- Standardizing formats
- Combining datasets
- Applying business rules
- Organizing records
This creates consistency across the organization.
Step 4: Data Analysis
Once the data is prepared, analysts begin exploring it to identify patterns and trends.
This may involve:
- Statistical analysis
- Business intelligence tools
- SQL queries
- Machine learning models
- Data visualization
The objective is to answer meaningful business questions.
Step 5: Data Visualization
Data becomes much easier to understand when presented visually.
Organizations often use:
- Dashboards
- Charts
- Graphs
- Interactive reports
Visualization allows decision-makers to quickly identify important trends.
Step 6: Business Decision-Making
The final step is using insights to improve business performance.
Analytics only creates value when it influences better decisions.
Common Business Applications of Data Analytics
Organizations across every industry use data analytics to improve performance.
Marketing Analytics
Marketing teams analyze customer behavior, campaign performance, and conversion rates to improve return on investment.
Sales Analytics
Sales teams identify high-performing products, forecast revenue, and improve sales performance.
Financial Analytics
Finance departments monitor profitability, budgets, cash flow, and business performance.
Customer Analytics
Organizations study customer behavior to improve satisfaction, retention, and loyalty.
Operational Analytics
Operations teams monitor production, logistics, and supply chain performance to improve efficiency.
Healthcare Analytics
Healthcare providers use analytics to improve patient outcomes, optimize resources, and support clinical decision-making.
Technologies Used in Data Analytics
Modern analytics relies on several technologies working together.
Common platforms include:
- Databricks
- Snowflake
- Microsoft Power BI
- Tableau
- Apache Spark
- SQL databases
- Python
- Google Cloud
- Microsoft Azure
- Amazon Web Services (AWS)
These technologies help organizations collect, process, analyze, and visualize large amounts of information efficiently.
Common Challenges in Data Analytics
Although analytics offers significant benefits, many organizations face similar challenges.
Poor Data Quality
Incomplete or inaccurate data reduces confidence in reporting.
Organizations must invest in data quality before building analytics solutions.
Data Silos
Information often exists across multiple disconnected systems.
Without integration, it becomes difficult to create a complete business view.
Limited Governance
Without governance, organizations struggle to maintain consistency, security, and accountability.
Strong governance supports reliable analytics.
Growing Data Volumes
Businesses generate more information every year.
Scalable platforms are needed to process increasing amounts of data efficiently.
Data Analytics and Artificial Intelligence
Data analytics and artificial intelligence work closely together.
Analytics helps organizations understand historical and current business performance.
AI builds on this foundation by identifying patterns, making predictions, and automating decisions.
However, AI cannot compensate for poor-quality data.
Organizations that invest in strong analytics foundations are far more likely to succeed with AI initiatives.
This is why many businesses now prioritize modern data platforms before deploying advanced AI solutions.
Best Practices for Successful Data Analytics
Organizations that achieve the best results typically follow several best practices.
Focus on Data Quality
Reliable insights require reliable information.
Data quality should always be a priority.
Build a Centralized Data Platform
A single source of truth improves reporting consistency and reduces duplication.
Implement Strong Data Governance
Governance improves security, ownership, compliance, and trust.
Automate Data Pipelines
Automation reduces manual work while improving consistency and reliability.
Continuously Monitor Performance
Analytics environments should evolve as business needs change.
Regular monitoring helps maintain performance and accuracy.
How Tenplus Helps Organizations Succeed with Data Analytics
Successful data analytics requires much more than dashboards and reporting tools.
Organizations need strong architecture, reliable data pipelines, scalable cloud infrastructure, and governance that supports long-term growth.
The Tenplus team supports organizations with:
- Data platform design
- Data engineering
- Databricks implementation
- Snowflake consulting
- Cloud architecture
- Data governance
- Real-time analytics
- AI-ready data foundations
Rather than focusing only on reporting, Tenplus builds complete analytics ecosystems that improve decision-making, reduce complexity, and prepare organizations for future AI initiatives.
Tenplus also offers a free proof of concept, allowing businesses to validate ideas before making larger investments.

Conclusion
Data analytics has become one of the most important capabilities for modern organizations. It allows businesses to understand what has happened, identify why it happened, predict future outcomes, and make smarter decisions based on reliable information.
However, successful analytics depends on much more than visualization tools. Organizations need clean data, scalable platforms, strong governance, and modern data engineering practices to generate meaningful insights.
As businesses continue investing in artificial intelligence and automation, the importance of data analytics will only continue to grow.
If your organization wants to modernize its analytics platform, improve data quality, or build an AI-ready data foundation, Tenplus can help design and implement solutions that deliver measurable business value while supporting long-term growth.
FAQs
What is data analytics?
Data analytics is the process of collecting, cleaning, organizing, analyzing, and interpreting data to support better business decisions.
Why is data analytics important?
Data analytics helps organizations improve decision-making, reduce costs, identify opportunities, understand customers, and prepare for AI initiatives.
What are the four types of data analytics?
The four types are descriptive, diagnostic, predictive, and prescriptive analytics.
What tools are commonly used for data analytics?
Popular tools include Databricks, Snowflake, Apache Spark, Power BI, Tableau, SQL, Python, AWS, Azure, and Google Cloud.
How can Tenplus help with data analytics?
Tenplus helps organizations build scalable data platforms, implement modern analytics solutions, improve data quality, strengthen governance, and create AI-ready data environments.



6 Responses